
Great ideas become a reality when you map out how to get from point A to point B. This process mapping helps you root out roadblocks, organize milestones, and visualize the finish line — so you know where you’re headed.
For project managers, process mapping is the best way to increase team efficiency and, in turn, productivity. You’ll ask for employee feedback to find awkward workflows and task redundancies so you can improve everyone’s process.
What’s process mapping?
Process mapping involves visually plotting out the tasks necessary to complete a workflow. Project managers create these maps to streamline processes and offer teammates a guideline for completing work.
While several process mapping formats exist, like flowcharts and swimlane roadmaps, most use the following symbols to visualize work:
- A rectangle represents a task within a process
- Arrows connect each step to showcase process flow
- Diamonds are decision points, splitting the path usually based on "Yes" or "No" answers
- An oval is the terminator at the beginning or end
- The D-shape is a process delay
- A parallelogram shows a process step’s input or output data
- A wavy bottom rectangle denotes a reference document
- A slanted top-line rectangle is a step that requires some sort of manual data input
- A rectangle with a double vertical line is a predefined sub-process existing outside the process map
Benefits of process mapping
When it comes to idea management and resource planning, nothing beats a beautifully designed process map. It's an excellent way to visualize and streamline your processes, offering various benefits, like helping you:
- Break down complex ideas into digestible steps
- Clearly identify inefficient processes and bottlenecks
- Create easy-to-understand visual process charts
- Plan for future risks through problem-solving
- Assign tasks and roles based on workflow diagramming
- Quickly create documentation based on what's in front of you
- Enhance communication with your team through visualizations
- Make quicker decisions based on visual analysis
- Improve team member proficiency and understanding of pertinent tasks and workflows
- Meet business standards such as ISO 9000 and ISO 9001 by clearly outlining procedures
Types of process mapping
When creating your business process map, choose a format that fits your process. Here are some of the most common options and what they’re best for.
Flowchart: This is the most basic of all workflow process maps, using symbols to lay out project or task work steps. It's generally presented sequentially so every team member can identify each step in order.
Cross-functional flowchart: Also known as a deployment flowchart, this version highlights the relationships between steps and the responsible departments. It's used to call out cross-functionalities within a project or process.
High-level process map: Commonly known as a value chain or top-down map, the high-level process map keeps each step as brief as possible, sticking to just the essential pieces of a workflow.
Detailed process map: Where the high-level map is less detailed, this one includes everything from subtasks and responsibilities to risk assessments. Producing this map type is one of the best ways to find inefficiencies, as you’ll thoroughly explore every step.
Process roadmap: A process roadmap takes the detailed process map further by visualizing every possible output from the starting point. This exercise is a great way to choose a procedure for a new task or project.
Swimlane map: You can use this map to clarify process roles and responsibilities or build an org chart, making this document an asset when onboarding new employees or introducing your team to a new client.
Value stream map: Used mainly in product management, a value stream map aims to eliminate waste and document data related to delivering a final product that satisfies customers.
SIPOC diagram: Closer to a chart than a map, a SIPOC diagram identifies the suppliers, inputs, process, outputs, and customers related to a workflow. Creating one helps you define a project’s scope, plan resources, and prepare for external stakeholder management.
How to create a process map in 5 steps
Follow this five-step process to create thorough and effective process maps that help you reduce redundancies and illuminate efficient workflows.
1. Choose your process
You’ll likely create several process maps, so start by choosing the one that requires more immediate attention. You might use this step to create a process prioritization list, chatting with your team to determine the ones they feel are least efficient or unclear and working your way to those that are quite effective. But ultimately, you’ll want to map out every process to increase clarity and streamline onboarding.
When deciding which process to start with, ask yourself the following questions:
- Have any teammates raised red flags about this process before?
- Are clients complaining about any factors related to this workflow?
- Is this a procedure new employees need to understand right away?
- Have we already identified a new — and better — way of completing this process?
Start by mapping out and improving processes causing employees and clients frustration, moving toward outdated ones and, finally, defining excellent workflows to create process visibility.
2. Identify the scope
Observe the entire process, defining the following factors:
- Start and end triggers, plus each task in between
- Milestones that showcase progress toward success
- Dependent and shoot-off tasks
- Final deliverables
3. Plan resources
Now, consider each step in depth, gaining a thorough understanding of how long each task takes, who’s responsible, and what they need to complete it, which might be technology, teamwork, or financial resources.
4. Map your process
Choosing a mapping tool depends on your business needs and project complexity. A simple flowchart is a great place to start, perhaps making it more detailed if necessary or, when noticing cross-functional teamwork, moving to a swimlane diagram.
Now, work with crucial teammates to map this workflow, considering all the data you’ve accumulated throughout your research. Once complete, double-check the process several times to ensure it’s accurate. Then, scrutinize your map, illuminating inefficiencies and noticing tools you might replace to speed up this procedure.
5. Gather feedback, share it
Show your process map draft to every stakeholder, from teammates to clients and crucial vendors. If relevant to end-user deliverables, ensure start and end dates align with client and customer expectations. And confirm with teammates that this map aligns with task times and bandwidths.
Once you’ve implemented feedback and eliminated redundancies and slowdowns, share this map someplace central, auditing it occasionally as tools and workflows change.
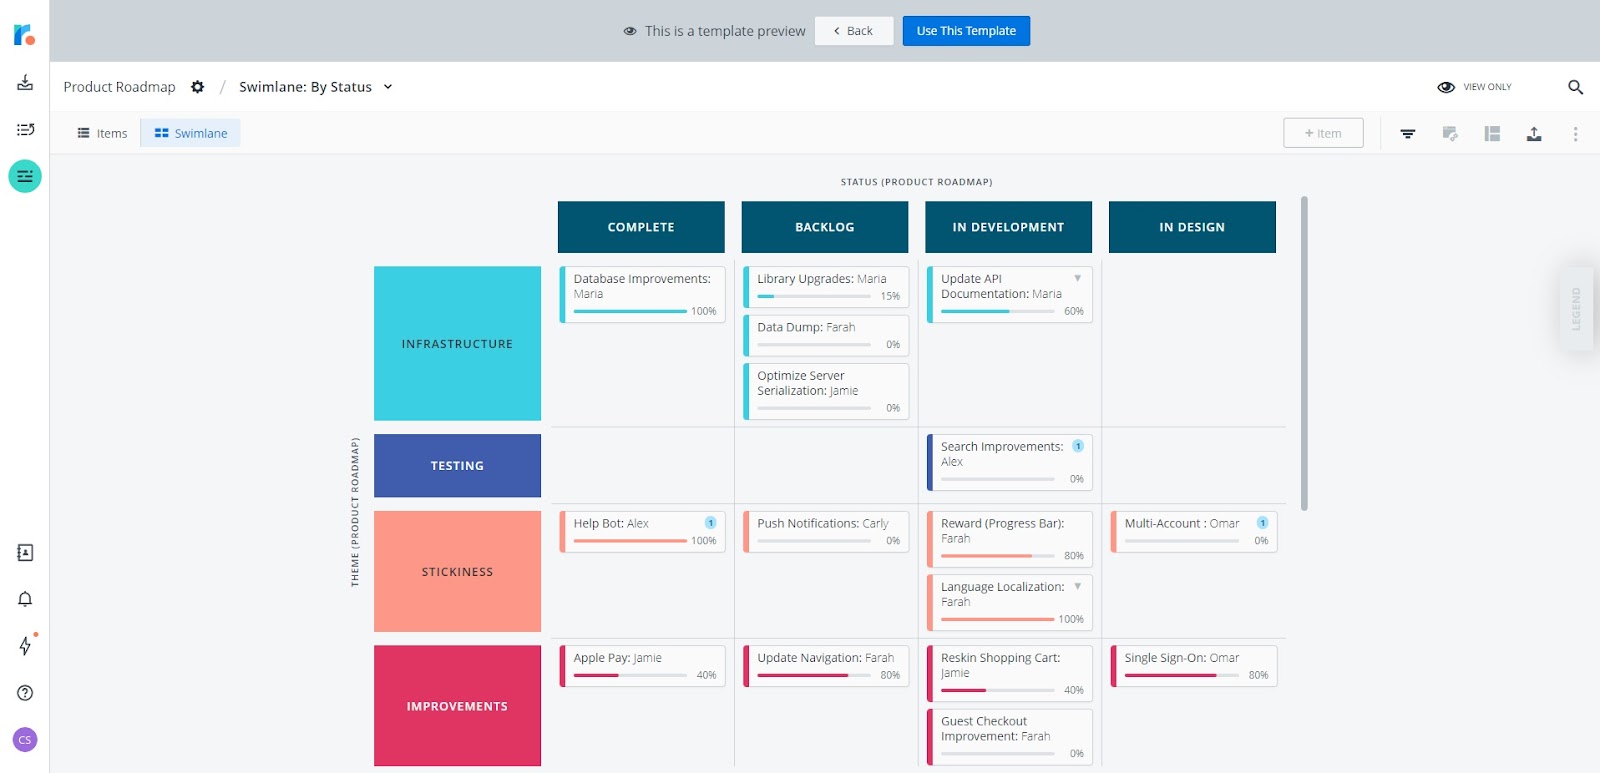
An example of a process map
This Tempo process map example breaks down a product roadmap across departments using a swimlane chart. It presents clear steps, roles, and process themes to deliver a visualization that helps cross-functional teams work efficiently.
Roadmap your processes with Roadmunk by Tempo
Once you’ve chosen a process to perfect, Roadmunk by Tempo has all the templates and tools you need to fully optimize your operations. Then, use Timesheets by Tempo to keep your processes running smoothly with efficient time tracking.